Open topic with navigation
Trial Balance Pivot Fund Report
The Trial Balance Pivot Fund Compare report provides an option for starting balance, debits and credits, budget, and an ending balance. It also gives users pivot table functionality (most notably found in Microsoft Excel), which includes interactive tables that automatically extract, organize, and summarize your data. You can use this report to analyze data, make comparisons, detect patterns and relationships, and discover trends.
To use the report, filter the data as with other reports and click the Preview icon. On the Trial Balance Pivot Fund Compare screen that appears, you can then drag and drop information to easily arrange the report's header, columns, and rows for a truly customized report. After building the customized report, you can either print the report, or export it to Excel.
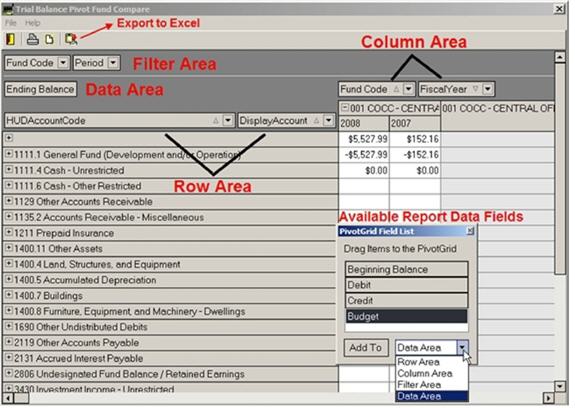
Filter Area: Within this area are field(s) from the source data that you assign to a filter. For example, Fund Code is a filter field. You can use the Fund Code field to display summarized data for only the Section 8 fund, etc.
Data Area: Within this area are field(s) from the source data that contain values to be summarized. For example, Ending Balance is a data field. (This data is displayed as headers at the top of a column.) For most types of source data you can choose how to summarize data (for example, by Ending Balance, Beginning Balance, Credit, Debit, or Budget). A data field usually summarizes numbers, but it can also summarize text.
Column Area: Within this area are fields from the source data that you assign to a column. For example, Fiscal Year is a column field. This data is displayed in the columns of the report.
Row Area: Within this area are fields from the source data that you assign to a row. For example, HUD Account Code is a row field.This data is displayed in the rows of the report.
Access the Trial Balance Pivot Fund Compare Report
|
1.
|
From the Main Menu screen, click REPORTS. The Ledger and HUD Reports screen appears with the General tab selected. |
|
2.
|
Select the Trial Balance Pivot Fund Compare radio button. The Trial Balance Pivot Fund Compare tab appears on the right side of the screen. |
Choose Source Data
|
3.
|
In the Fund Selection area of the tab, check the checkboxes of the funds you’d like to include in the report. |
- Use
 or
or  to quickly check either all of the funds, or none.
|
4.
|
Choose up to three groups by which to group the selected funds. |
- To make the account(s) part of a report group, enter your selection into the report group #1 field.
- To make the account(s) part of another report group, enter your selection into report group #2.
- To make the account(s) part of a third group, enter your selection into report group #3.
|
5.
|
Specify the date range on which to report and, if desired, a range of account numbers (not required). |
|
6.
|
Click  on the toolbar to access the Trial Balance Pivot Fund Compare screen. on the toolbar to access the Trial Balance Pivot Fund Compare screen. |
Customize Report
Once on the Trial Balance Pivot Fund Compare screen, you can:
View a different filter field:
|
ü
|
To view a different filtering of the report data, click the arrow next to a field in the filter area, and then check the checkbox of the data you want to view. Check “Show All” to view all filters. |
Add report data fields:
|
ü
|
Right-click anywhere on a filter area, data area, column area, or row area field and select the Show Field List button that appears. You can open from this button a list of available report data fields. |
|
ü
|
Select the field you want to add from the list and drag it to the area in which you want to place it. Or, highlight the field, select the appropriate data area from the drop-down list and click ADD TO. |
Reorganize data fields:You can quickly “pivot” the report by moving a field to another report area, or reordering the items within a report area.
|
ü
|
To move a field to another area, click on the field and drag it to the appropriate area of the screen. |
|
ü
|
To reorder fields within an area, click on the field and drag it to the new location; or, right-click on the field, select “Order” from the menu that appears, and choose where to move it. |
Show or hide data field in a row or column area:
|
ü
|
Right-click anywhere on a column area or row area field and select “Hide” from the menu that appears. The field is removed/hidden and placed in the available report data fields list. |
Caution! There is no indication on the screen that one or more items are hidden and there is no way to undue or “unhide” the field. You must add the field manually from the available report data fields list.
|
ü
|
To view different data in a row or column area, click the arrow next to a row/column header field, and then check the checkbox of the data you want to view. Check “Show All” to view all fields. |
Show or hide specific details for field:
|
ü
|
Click on the “+” next to the field you want to expand; or, click the “-” to collapse the expanded details. Or, right-click on the expanded/collapsed field and select to either expand/collapse just the one field, or expand/collapse all fields at once. |
Note: You cannot directly edit the data in the Trial Balance Pivot Fund Compare report. Instead, you need to edit the source data and then regenerate.
|
7.
|
When you are finished customizing the report details, you can: |
|
ü
|
Click again to preview the report as it will be printed. |
|
ü
|
Click  to print the report. The report will print similar to an Excel spreadsheet; use the toolbar options on the Print Preview screen to fit the report onto one page. to print the report. The report will print similar to an Excel spreadsheet; use the toolbar options on the Print Preview screen to fit the report onto one page. |
|
ü
|
Click  to export the report to Excel. to export the report to Excel. |
|
ü
|
Click  to exit and return to the Ledger HUD Reports screen. to exit and return to the Ledger HUD Reports screen. |
Caution! Once you exit the screen, ALL report details will be lost!
Copyright © Tenmast Software 2011